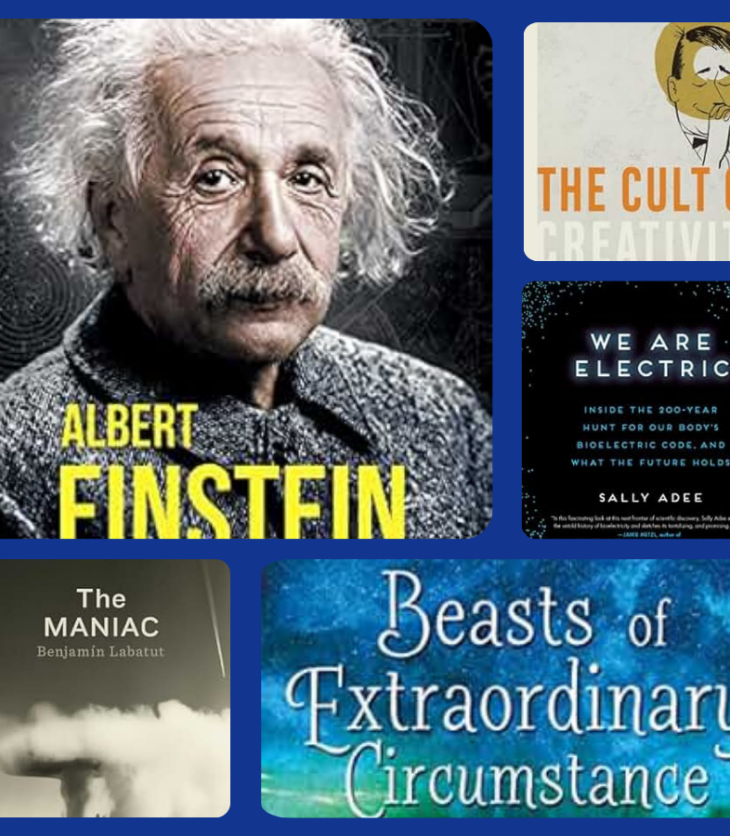
I’m not sure I’ve had a year when I’ve read such a diverse array of…
Information Security Analyst, Author, and Instructor
I’m not sure I’ve had a year when I’ve read such a diverse array of…
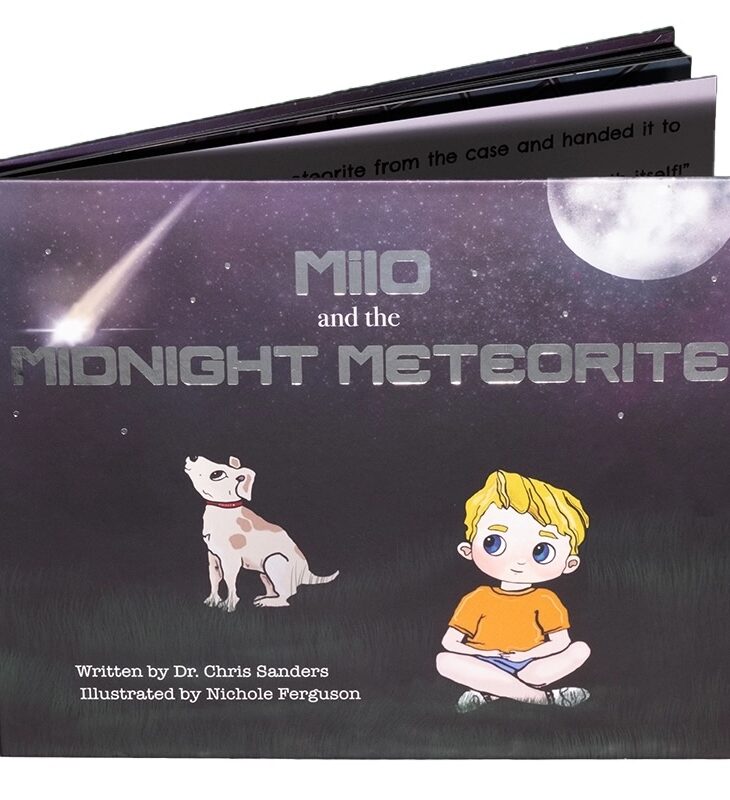
Let’s talk about something a bit off the beaten path around here… space! Those who…

An investigation playbook contains a collection of repeatable investigation steps for specific scenarios. While some…
People frequently speak about “getting through” grief. The truth is that you never get through;…
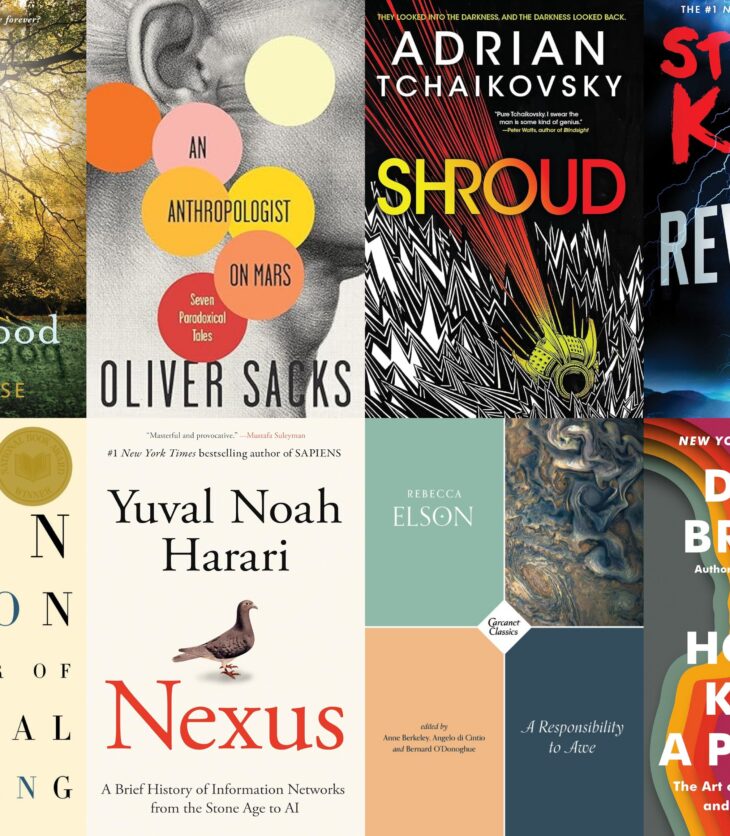
Each year, I like to reflect on the best things I’ve read over the course…
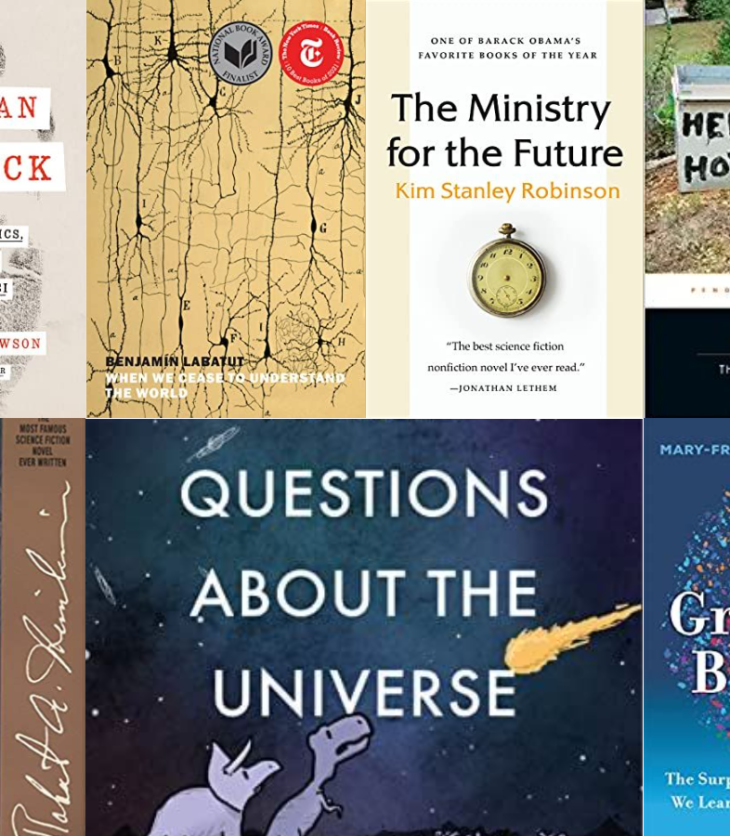
Each year, I like to reflect on the best things I’ve read over the course…

I’m excited to announce my 2022 Golden Ticket Fundraiser! With this fundraiser, you’ll have a…
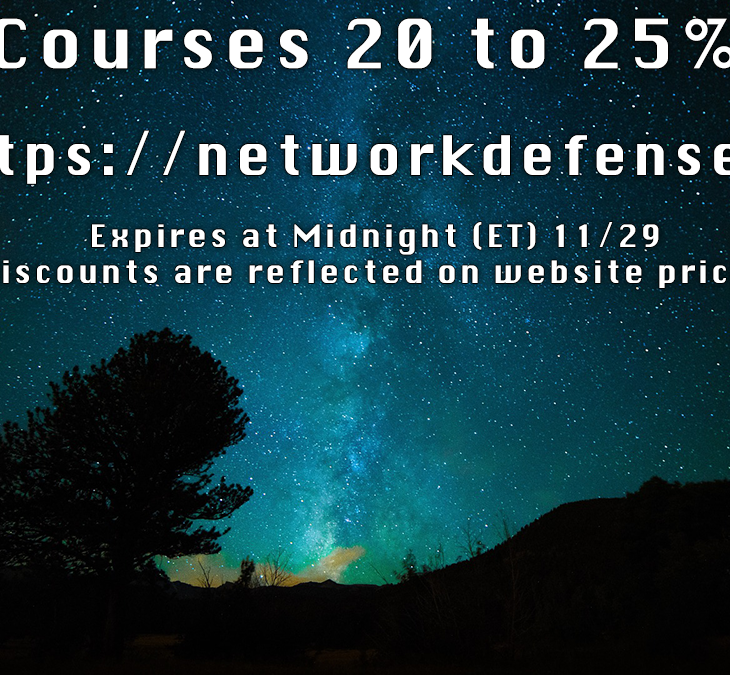
Once a year, all of my training courses go on sale. This year, that sale…
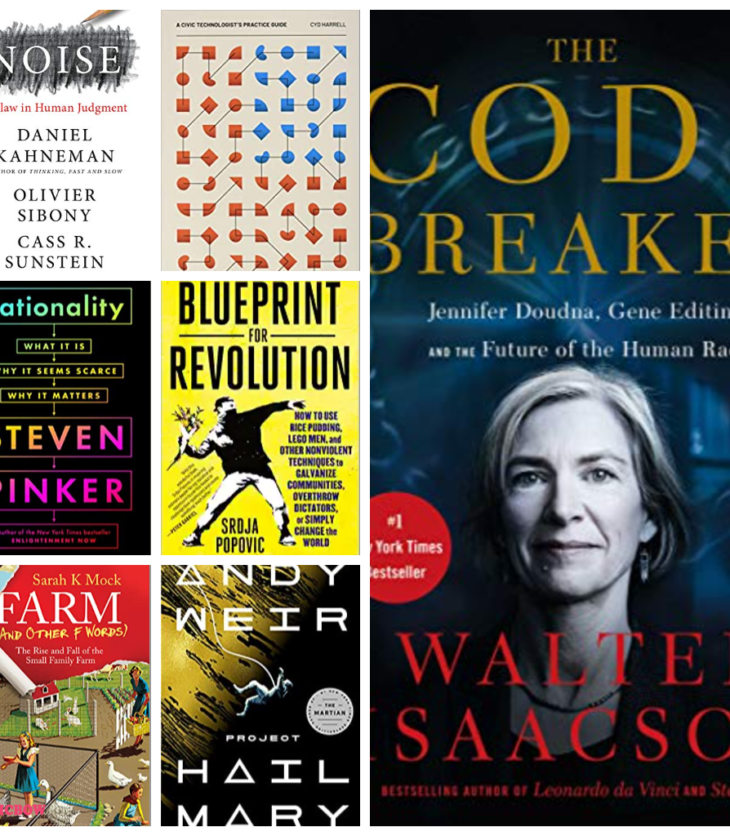
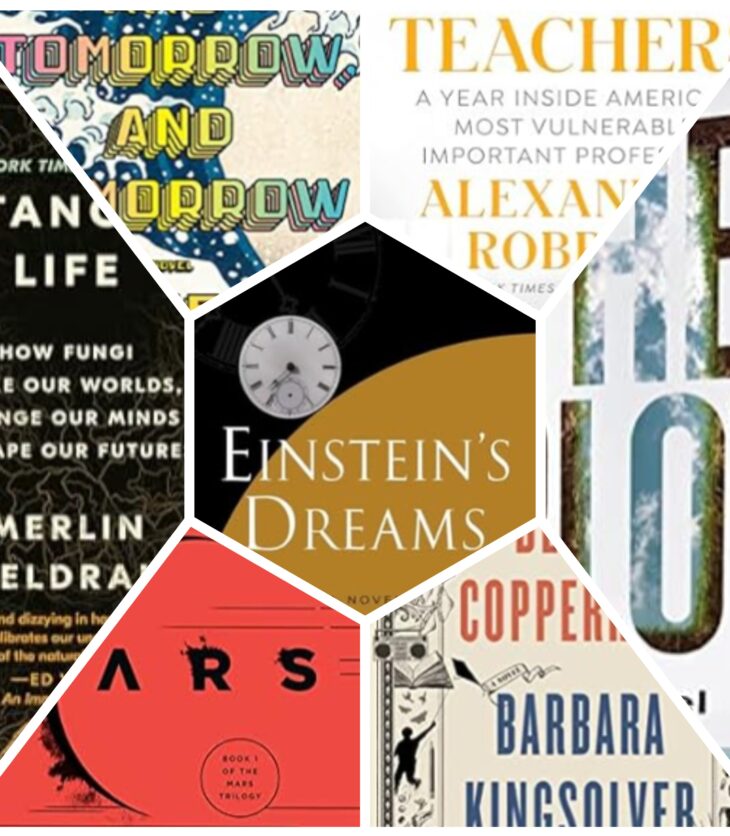
Each December, I like to reflect on the best things I’ve read over the course…
In September of this year, I successfully defended my doctoral dissertation, earning the title of…