What follows is a shortened version of a longer paper that will be released at a later time. You can also learn more about this research by watching my recent Security Onion Conference 2016 video where I discuss these results and other similar experiments.
Background
The core construct of computer network defense is the investigation. It’s here where human analysts receive anomalous signals and pursue evidence that might prove the existence of an information system breach. While little formalized methodology related to the investigation process exists, research in this area is beginning to emerge.
Existing research in human thought and knowledge acquisition is applicable to information security and computer network defense. Daniel Kahneman provided modern research in support of a dual-process theory of thinking that defines two separate processes governing human thought. The first process, called intuitive or system 1 thinking, is automatic and usually kicks in without directly acknowledging it. You don’t have to think about brushing your teeth or starting your car, you just do it. The second process, called reflective or system 2 thinking, is deliberate and requires attentive focus. You have to think about math problems and your next move when playing checkers. Both of these systems are in play during the investigation process.
In an investigation, analysts use intuitive thought when pursuing data related to an alert. This is most often the case when the analyst makes their opening move. The analyst’s opening move is the first data query they execute after receiving an alert. By virtue of being the first move, the analyst doesn’t apply a lot of explicit reflective thought on the issue and they simply jump to the place they believe will provide the quickest and most definitive answer. It’s assumed that in these cases, the analyst’s first move is probably the data source they perceive as being the most valuable.
The goal of the present research is to determine which common data source analysts were more likely to use as their opening move, and to assess the impact of that first move on the speed of the investigation.
Methods
The foundation of this research was a purpose built investigation simulator. The investigation simulator was built to recreate the investigation environment in a tool agnostic manner, such that individual scenarios could be loaded for a sample population and the variables could be tightly controlled.
A pool of security analysts was selected based on their employment history. Every analysts selected was currently or recently in a role were they were responsible for investigating security alerts to determine if a security compromise had occurred. Demographic information was collected, and analysts were placed into three skills groups based on their qualifications and level of experience: novice, intermediate, or expert.
Group A – Exploit Kit Infection
The primary experiment group was asked to connect to the investigation simulator remotely and work through the investigation scenario provided to arrive at a conclusion whether an infection or compromise had successful occurred.
The scenario presented the user with a Suricata IDS alert indicating that an internal host visited an exploit kit landing page.
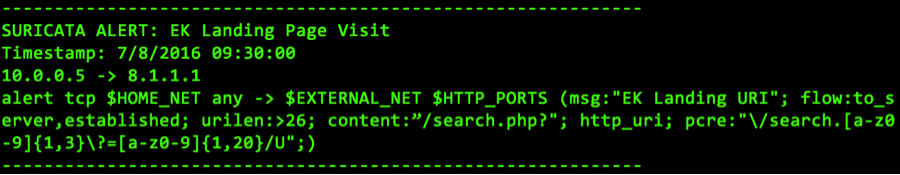
Figure 1: The Suricata IDS alert that initiated the simulation
The following data sources were provided for investigation purposes:
| Data Source | Query Format | Output Style |
| Full packet capture (PCAP) | Search by IP or port | TCPDump |
| Network flow/session data | Search by IP or port | SiLK IPFIX |
| Host file system | Search by filename | File path location |
| Windows Logs | Option: User authentication/process create logs | Windows event log text |
| Windows Registry | Option: Autoruns/System restore/application executions (MUI cache) | Registry keys and values |
| Antivirus Logs | Search by IP | Generic AV log text |
| Memory | Option: Running process list/Shim cache | Volatility |
| Open Source Intelligence | Option: IP or domain reputation/file hash reputation/Google search | Text output similar to popular intelligence providers |
Table 1: Data source provided for Group A
Subjects were instructed that they should work towards a final disposition of true positive (an infection occurred), or false positive (no infection occurred). Whenever they had enough information to reach a conclusion, they were to indicate their final disposition in the tool, at which point the simulation exited.
The simulator logged every query the analysts made during this experiment, along with a timestamp and the start and end time. This produced a timeline of the analysts enter investigation, which was used to evaluate the research questions.
Group B – PCAP Data Replaced with Bro Data
Based on results achieved with group A, a second non-overlapping sample group of analysts were selected to participate in another experiment. Since group indicated a preference for higher context PCAP data, the second scenario removed the PCAP data option and replaced it with Bro data, another high context data source that is more structured and organized. The complete list of data sources provided for this group were:
| Data Source | Query Format | Output Style |
| Bro | Search by IP | Bro |
| Network flow/session data | Search by IP or port | SiLK IPFIX |
| Host file system | Search by filename | File path location |
| Windows Logs | Option: User authentication/process create logs | Windows event log text |
| Windows Registry | Option: Autoruns/System restore/application executions (MUI cache) | Registry keys and values |
| Antivirus Logs | Search by IP | Generic AV log text |
| Memory | Option: Running process list/Shim cache | Volatility |
| Open Source Intelligence | Option: IP or domain reputation/file hash reputation/Google search | Text output similar to popular intelligence providers |
Table 2: Data source provided for Group B
All experiment procedures and investigation logging measures remained in place, consistent with group A.
Group C – Survey Group
A third semi-overlapping group was selected at random to collect self-reported statistics to assess what opening move analysts self reported they would be more likely to make given a generic investigation scenario.
Using a combination of manually polling analysts and collecting responses from Twitter polling, analysts were asked the following question:
In a normal investigation scenario, what data source would you look at first?
The multiple-choice options presented were:
- PCAP
- Flow
- Open Source Intelligence
- Other
Results
The first item evaluated was the distribution of opening moves. Simply put, what data source did analysts look at first?
In Group A, an 72% of analysts chose PCAP as their first move, 16% chose flow data, and the remaining 12% chose OSINT. The observed numbers differ significantly from the numbers analysts reported during information polling. In the Group C polling, 49% of analysts reported PCAP would be their first move, 28% chose flow data, and 23% chose OSINT.
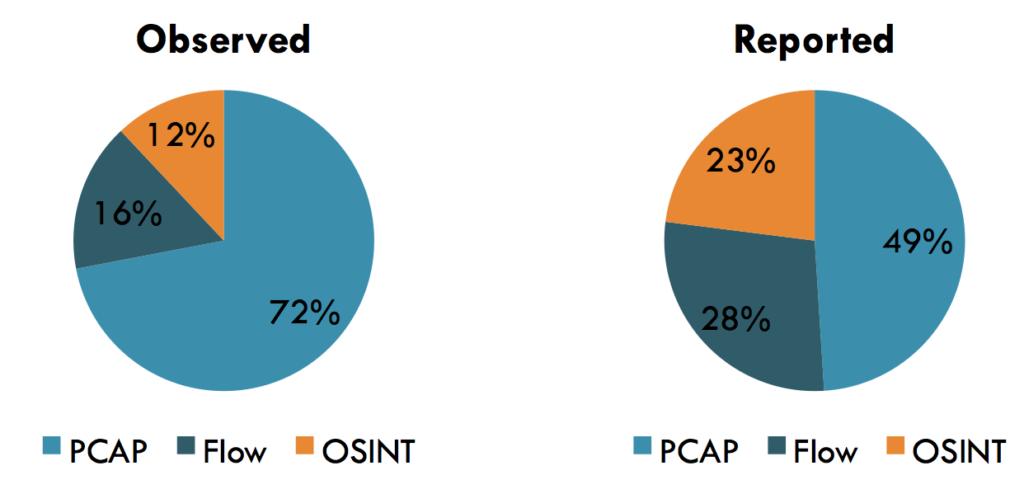
Chart 1: Opening move selection observed for Group A
The mean time to disposition (MTTD) metric was calculated for each first move group by determining the difference between start and end investigation time for each analysts and averaging the results of all analysts within the group together. Analyst’s who chose PCAP had a MTTD of 16 minutes, those who chose flow had a MTTD of 10 minutes, and those who chose OSINT had a MTTD of 9 minutes.
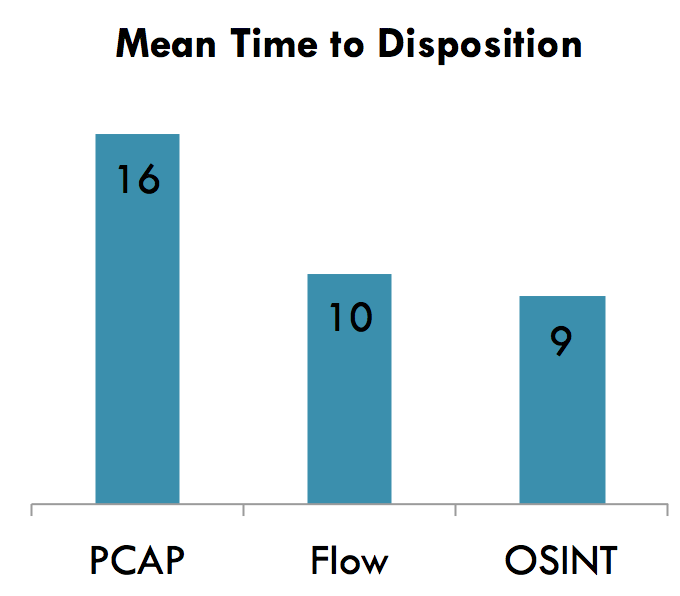
Chart 2: Time to disposition for Group A
In Group B where PCAP data was replaced with Bro data, 46% of analysts chose Bro data as their first move, 29% chose OSINT, and 25% chose flow.
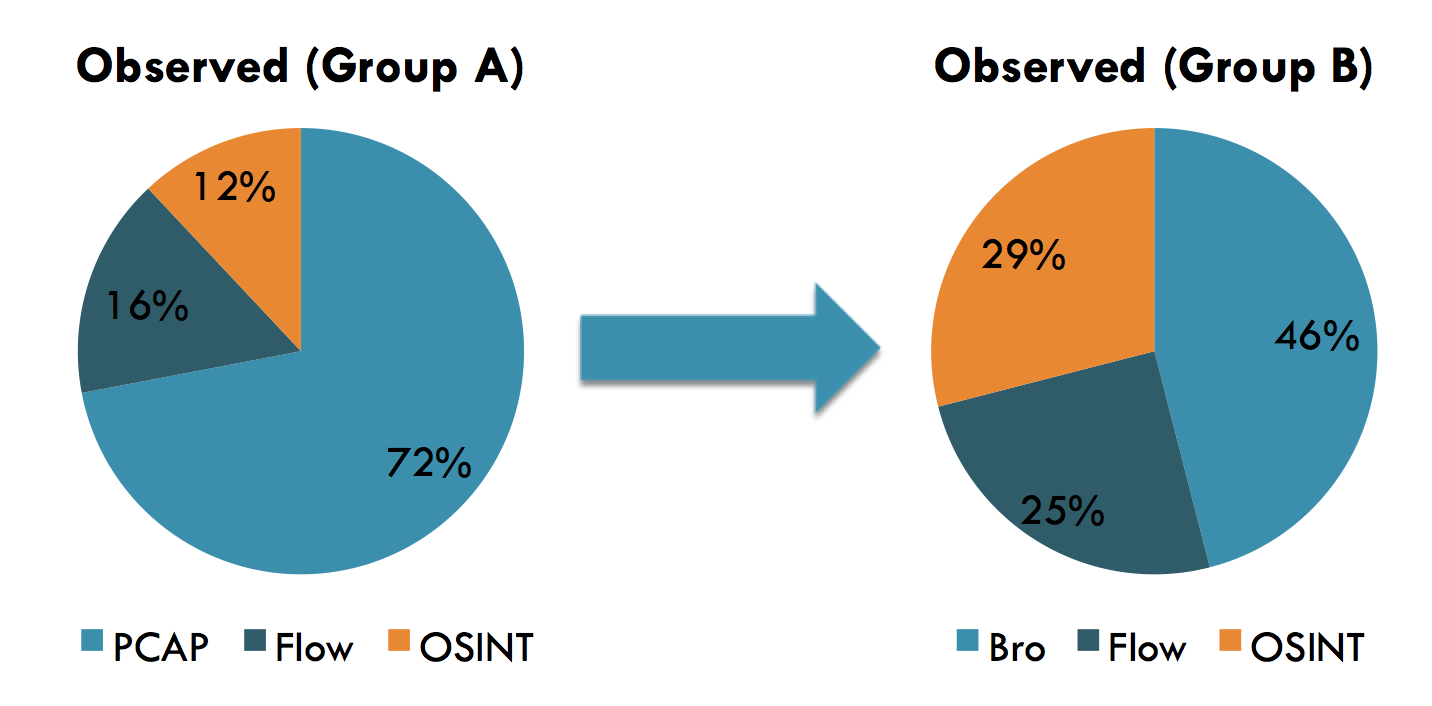
Chart 3: Comparison of group A and B opening moves
Analysts who chose Bro had a MTTD of 10 minutes, while those who chose flow and OSINT and MTTDs of 10 minutes and 11 minutes, respectively.
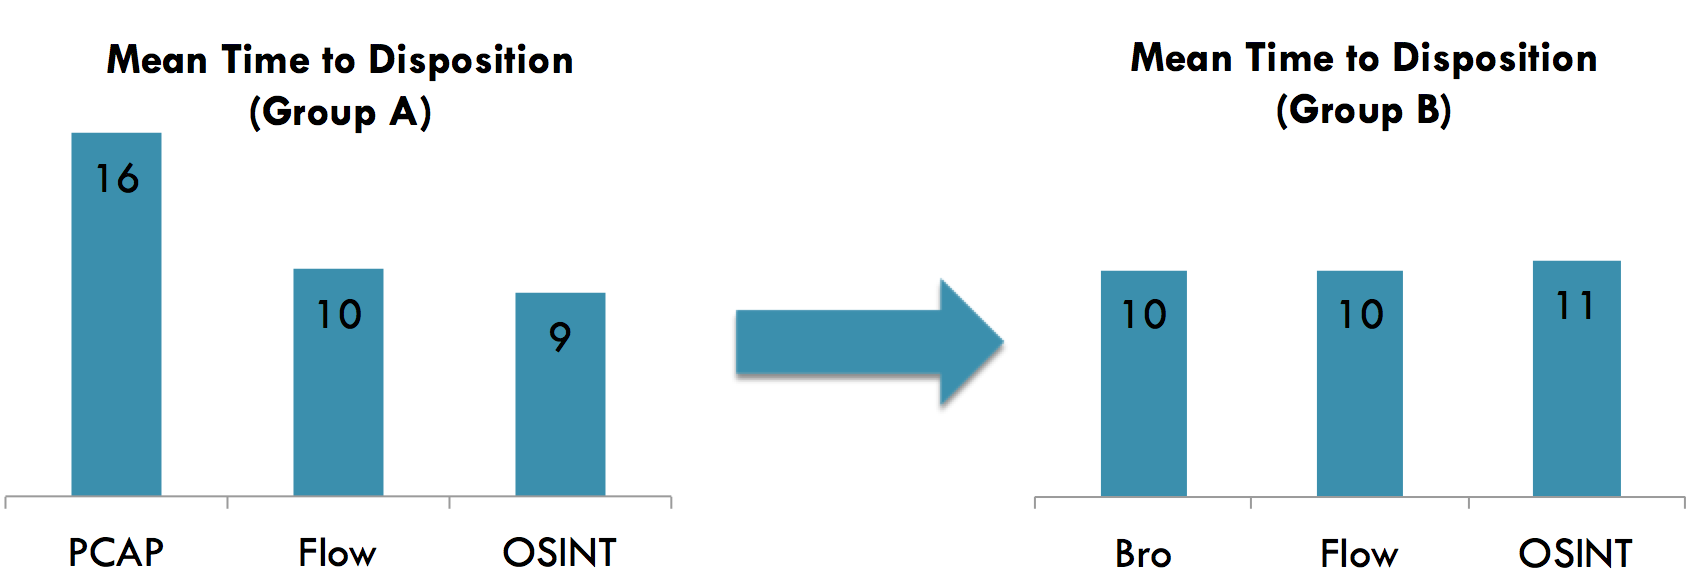
Chart 4: Comparison of group A and B average time to close
Discussion
While not entirely conclusive, the data gained from this research does provide several suggestions. First, given an overwhelming 72% of people chose to begin their investigation with PCAP data, it’s clear that analysts prefer a higher context data source when its available, even if other lower context data sources available. In these simulations there were multiple ways to come to the correct conclusion, and PCAP data did not have to be examined at all to reach it.
The data also suggests that an opening move to a high context but relatively unorganized data source can negatively affect the speed an analyst reaches an appropriate conclusion. The MTTD for analysts whose opening move was PCAP in Group A was significantly higher than those who started with lower context data sources flow and OSINT. This is likely because PCAP data contains extraneous data that isn’t beneficial to the investigator, and it takes much longer to visually parse and interpret. Examining the results of the group B experiment further supports this finding. PCAP was replaced with Bro log data, which generally contains most of the same useful information that PCAP provides, but organizes it in a much more intuitive way that makes it easier to sift through. Analysts who chose Bro data for their opening move had a MTTD that was much lower than PCAP and comparable to flow and OSINT data sources.
The comparison between observed and reported opening moves highlights another finding that analysts often don’t understand their own tendencies during an investigation. There was a significant difference between the number of people who reported they would choose to investigate an anomaly with PCAP, and those who actually did. Opening move selection is somewhat situational however, so the present study did not introduce enough unique simulations to truly validate the statistics supporting that finding.
Possible limitations for this study mostly center on a limited number of trials, as only one simulation (albeit modified for one group) was used. More trials would serve to strengthen the findings. In addition, there is some selection bias towards analysts who are more specialized in network forensics than host forensics. This likely accounts for no first moves being to host-based data. Additionally, in the simulations conducted here access to all data sources took an equal amount of time. In a real world scenario, some data sources take longer to access. However, since PCAP and other higher context data sources are usually larger in size on disk, the added time to retrieve this data would only strengthen these findings that PCAP data negatively affects investigation speed.
Conclusion
Overall, this research provides insight into the value of better organized higher context data sources. While PCAP data contains an immense level of context, it is also unorganized, hard to filter and sift through compared to other data types, and has extraneous data not useful for furthering the investigation. To improve investigation efficiency, it may be better to make opening moves that start with lower context data sources so that a smaller net can be cast when it comes time to query higher context sources. Furthermore, when more organized higher context data sources are available, they should be used.
While the present research isn’t fully conclusive due to its sample size and a limited number of simulation trials, it does provide unique insight into the investigation process. The methods and strategy used here should be applicable for additional research to further confirm the things this data suggests.
—
Interested in learning more about the investigation process, choosing the right data sources to look at, and becoming a better analyst? Check out my Investigation Theory training course and others here.