If you’ve eaten stew, drank whiskey, or put gas in your car then you’ve been the benefactor of distillation. This process is designed to reduce something down to an essential value or meaning and it has a place in data analysis too. If you can distill a PCAP down to key events then you’ll have a much more manageable set of data points to aid your investigation.
In part three of this series, I’ll describe how I distill packet captures using Suricata, Bro, and PRADS.
You can find the first two parts of this series here:
Flagging Anomalies with IDS
Intrusion detection exists to reducing large data streams down to anomalies that generate interesting questions and warrant investigation. We usually think of network-based intrusion detection as something that can only run in real-time on the wire, but most IDS tools can be run on-demand too.
Suricata is one of the world’s most popular signature-based IDS tools and can be paired with free signature sets like the one from Emerging Threats. The most common use of Suricata is to place it at a network choke point and use it to monitor the downstream devices. Because traffic volumes can be large, this strategy forces you to carefully evaluate the signatures you enable so you’re not overloaded with lower quality alerts, a scenario which defines the challenge of scaling intrusion detection techniques. When dealing with individual capture files, even very large ones, you’re still not looking at anything remotely the same scale as an entire network segment. The lower data volume opens up your detection playbook to run a large PCAP through an IDS with nearly every signature enabled. Throw the kitchen sink at it!
As an example, I’ve run an 85MB PCAP file containing ~90,000 packets through Suricata with most of the Emerging Threats rule set enabled using the command:
suricata -c suricata.yaml -r packets.pcap -l suri/
The suricata.yaml configuration file defines my network ranges, the rule set I’m using, and enables output to the simple text-based fast.log file. I’ve also specified the PCAP to analyze and the directory to output my logging results. The signature matches (alerts) are shown in Figure 1.
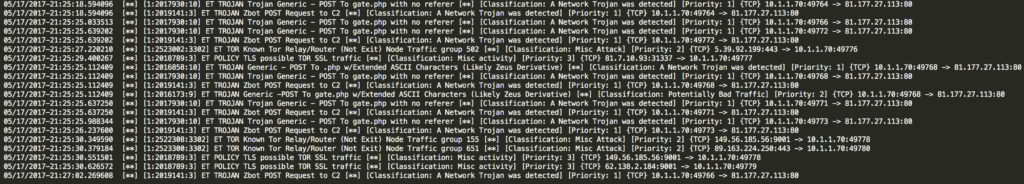 Figure 1: Alerts generated from analyzing the PCAP with Suricata
These packets indicate the presence of malicious activity using broader signatures than I might feel comfortable enabling on a production IDS. Some of the findings are more specific (the Zeus HTTP POSTs) while others are a bit broader and not inherently malicious (Known Tor Relay/Router). There are also interesting events in the PCAP that the IDS didn’t find, but that’s okay. By providing interesting insertion points into the PCAP, you can work forwards or backward from those points to help build a timeline of events. If I went through this PCAP manually it would take much longer to find these things and I would certainly miss several of them too.
Some rules are too noisy even for this approach. For example, I disabled rules that would alert me to invalid checksums because I don’t care about those for my purposes. You’ll eventually start to maintain a list of IDS rules specifically for analyzing individual PCAPs.
Finding Key Events with Bro
Everyone loves PCAP because it almost always contains the answer you’re looking for if that answer can be found in network data. The tradeoff is that PCAP data is bloated and contains much more information than necessary to answer most questions. It’s expensive to store, process, and analyze. These are all reasons why so many other forms of packet-derived network data exist, like network flows and the summary data generated by Bro.
Bro is a network monitoring and scripting platform that interprets network data and distills it into key events. The premise is simple — you don’t usually need an entire packet to understand what the packet does or to answer questions about it. For example, most questions about a DNS transaction can be answered with just the source IP, destination IP, and query information. Bro has a DNS plugin that strips this data out of the packet and places each DNS transaction on a single line in a log file that much faster to parse and interpret.
In 2016 I researched how the context provided by a data source affects the efficiency of an investigation. I conducted an experiment comparing the investigation efficiency of a group investigating a scenario based on using PCAP first compared to a different group using Bro first. The Bro group was able to get the correct answer much faster. This experiment demonstrates how investigation performance can be enhanced by distilling a high-context data source into important events that still provide enough value to answer the questions likely to be asked. The best data source is the one that answers the question accurately, the fastest.
Practically speaking, that means you can use Bro to reduce a PCAP to important events while increasing your investigation efficiency. For example, I used Bro to read a PCAP with 20,000 packets using this command:
bro -r packets.pcap
As shown in figure 2, the output produced 8 files with 197 unique events.
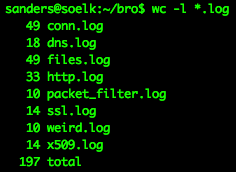
Figure 2: Events generated from analyzing the PCAP with Bro
Some of these events are likely to generate questions worth pursuing, such as those in the weird.log file that Bro uses to note things are, well…weird. Many of the other events are useful for answering questions generated from other inputs (such a from the IDS example above). Of course, you can also write your own Bro scripts to use as part of this process.
Asset Identification with PRADS
An investigation normally requires you to identify important role players and their characteristics so you can better understand the relationships that exist between them. This is tricky when approaching a large packet capture because there are so many assets to contend with and you don’t yet know which ones are important.
Tools like Wireshark and Tshark provide basic functionality to enumerate all the endpoints it observes. I use these feature often, but they don’t provide the context I want early in the investigation process. The Passive Real-time Asset Detection System (PRADS) serves the function of asset identification well. It listens to network data and builds a list of the assets it encounters and their characteristics.
Like the other tools I’ve discussed, PRADS can also be run on an individual PCAP using this command:
prads -r packets.pcap
The output yields a simple CSV file listing assets and the observed characteristics.
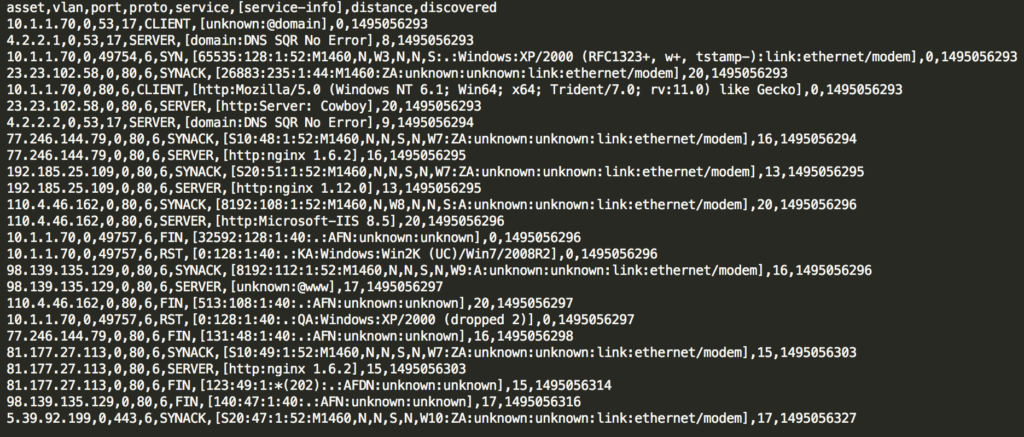
Figure 3: An asset list generated from PRADS
PRADS data can be used to help answer questions about the nature of specific assets. It can also help form questions when you identify services or characteristics that are unexpected. Is that a Windows XP system in Figure 3!?
Lastly, asset data can be fed into other analysis tools to augment working memory. I frequently map IP addresses to system roles using Wireshark’s manual hostname resolution feature (see the bottom part here: https://wiki.wireshark.org/Preferences/NameResolution).
Combining Processes with Security Onion
I’ve described several tools that will distill large packet captures down to useful tidbits to guide your investigation. However, running these tools repeatedly can be cumbersome. You could write a script that automates the whole process for you, but I usually take an even easier route by using Security Onion (SO).
Security Onion is a free Linux distribution for intrusion detection and network security monitoring. It includes several best of breed tools and wraps them together in a tidy package that’s suitable for deployment as a production server/sensor platform or for experimentation in a lab. I wrote about SO in my Applied Network Security Monitoring book and still use it nearly every day.
All the tools I’ve mentioned in this post can be found on SO, but even better, they make it easy for you to replay PCAPs into the SO toolset using a single script. To replay a PCAP, run this command:
so-import-pcap packets.pcap
Not only will this run the PCAP through all the tools mentioned here (if you’ve got them enabled in your SO config), it will also send the results to the Elastic stack so you can analyze them in a web interface. As a major bonus, it also preserves the timestamps associated with the original PCAP.
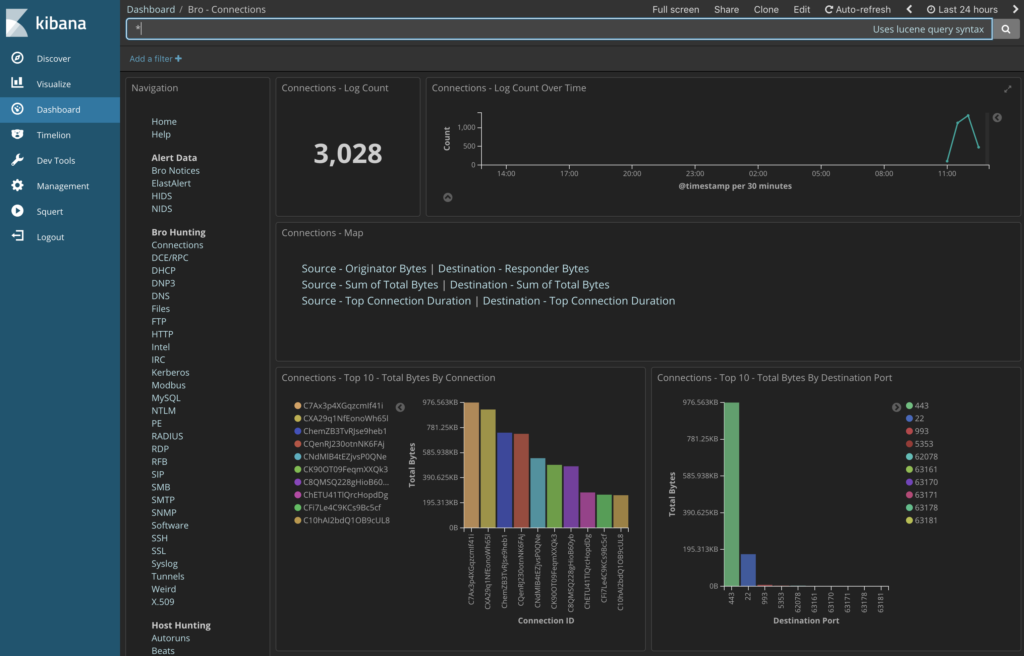
Figure 4: Investigating data generated from the PCAP in Kibana after using so-import-pcap
The whole process only takes a minute and provides a wealth of useful information distilled from the original PCAP. I make this process an early part of most investigations that begin with a PCAP.
Conclusion
I frequently share the anecdote that packet analysis is no more about Wireshark than astronomy is about a telescope. We use tools to help process information and answer questions, and those tools don’t necessarily have to be those dedicated to visual packet analysis. The larger and more complex a capture file, the more tools I often use to distill it down to key events that help serve as an insertion point for asking and answering questions. In this post, I shared a few of those tools and how they can provide value. If you haven’t already, give them a try!
—
If you like this article, you’ll really like my online packet analysis course. It’s packed with over 40 hours of training. You’ll learn how to decipher common protocols at the packet level, normal/abnormal stimulus and response, and more techniques for investigating anomalies. You’ll do this while going through hands-on exercises using Wireshark and command-line based packet analysis tools. You can learn more about the class here.